
How to Use the Surf Forecast Dashboard
The Surf Forecast Dashboard is designed to help surfers make a better call before heading to the beach. Instead of jumping between separate pages for swell, wind, tide, surf reports, and board choice, the dashboard brings the most useful information into one place.
The basic question is simple:
Where should I surf, when should I go, and what board should I bring?
The best way to start is by adding your surfboard quiver.
Step 1: Add Boards to Your Quiver
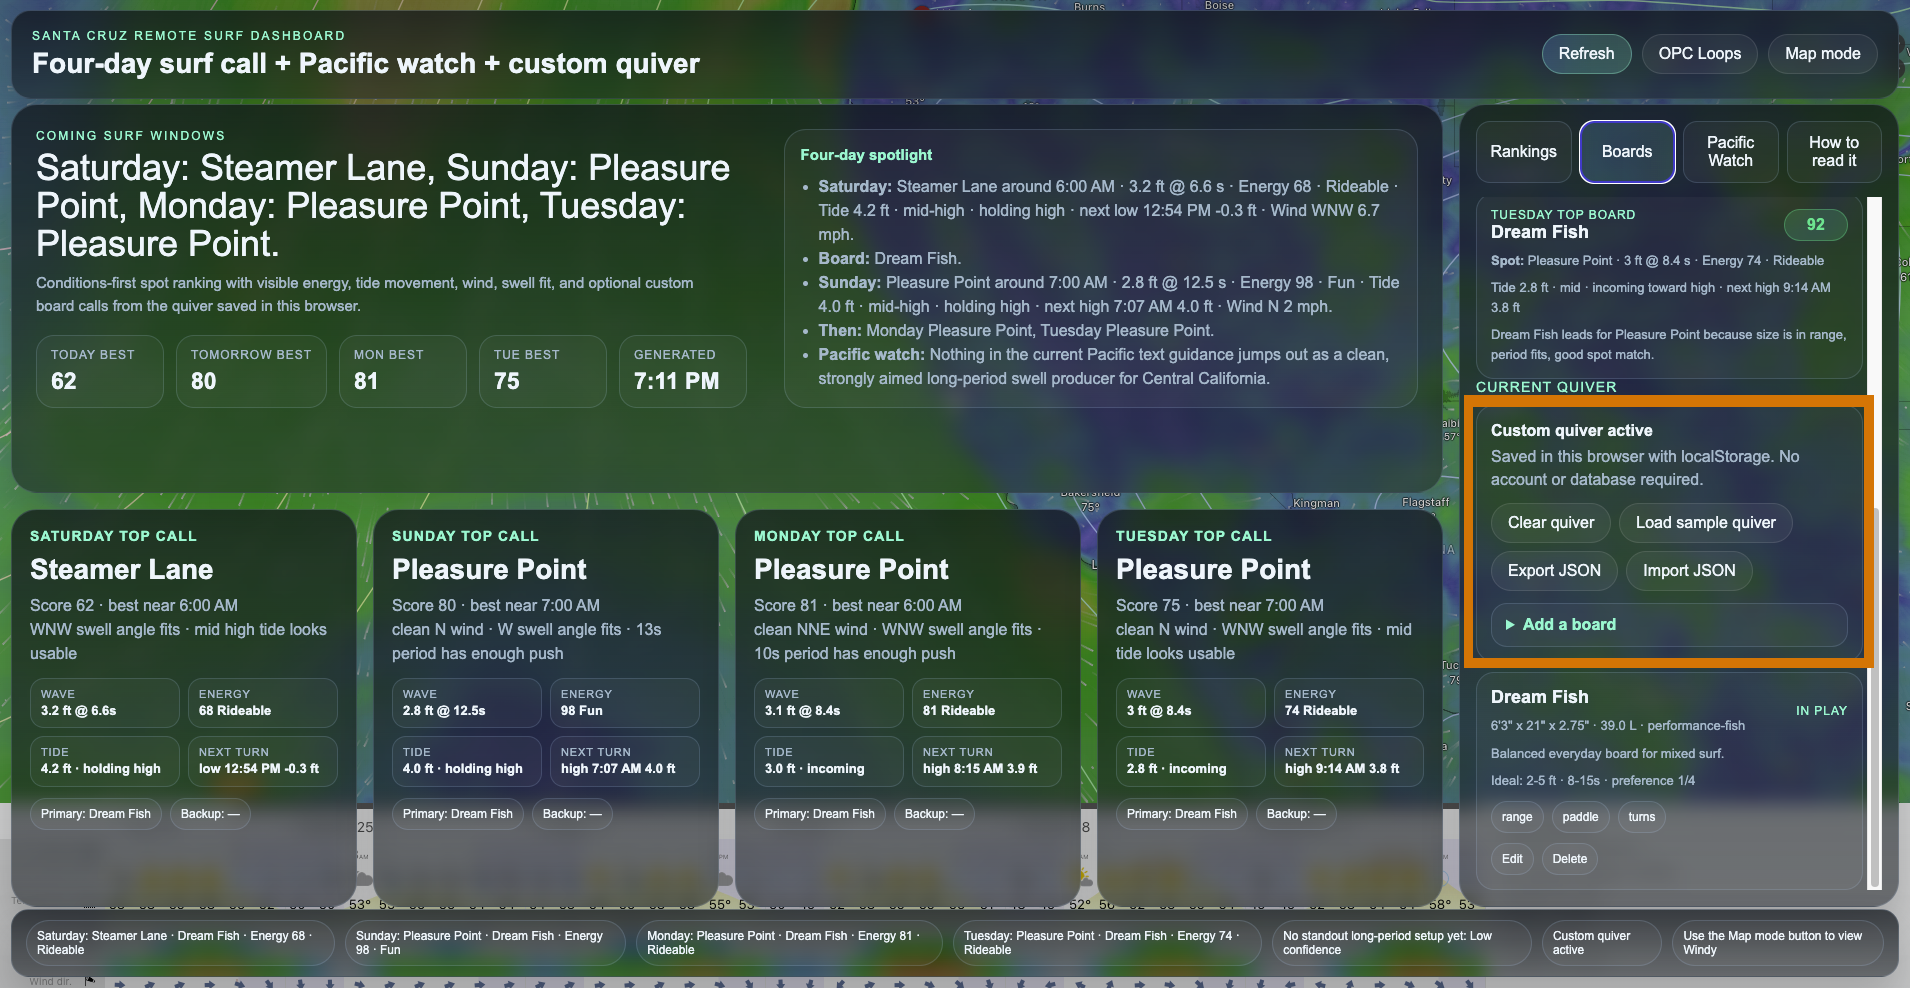
Start by opening the Boards tab.
This is where you can enter the surfboards you actually ride, so the dashboard can give more personalized board recommendations.
For each board, you can enter details such as:
- board name
- length
- width
- thickness
- volume
- board type
- preferred wave size
- preferred wave period
- favorite/preference level
- notes
You do not need perfect information to get started. Even basic details like board name, volume, type, and preferred wave size are enough to make the recommendations more useful.
For example:
Dream Fish
Type: Fish
Best for: clean, playful surf
Preference: High
Midlength
Type: Midlength
Best for: softer waves, extra paddle, more glide
Preference: Medium or High
Once your boards are added, the dashboard can begin matching your quiver to the forecast.
Step 2: Save, Export, or Import Your Quiver
Your quiver is saved directly in your browser.
That means if you close the page and come back later on the same device and browser, your boards should still be there.
Your quiver may be lost if you:
- clear browser data
- use private/incognito mode
- switch to another browser
- switch to another device
To make this easier, the dashboard includes Export JSON and Import JSON options.
Use Export JSON to save a backup of your quiver. Use Import JSON to restore it later or move it to another device.
This gives you a simple personalized setup without needing a login or account.
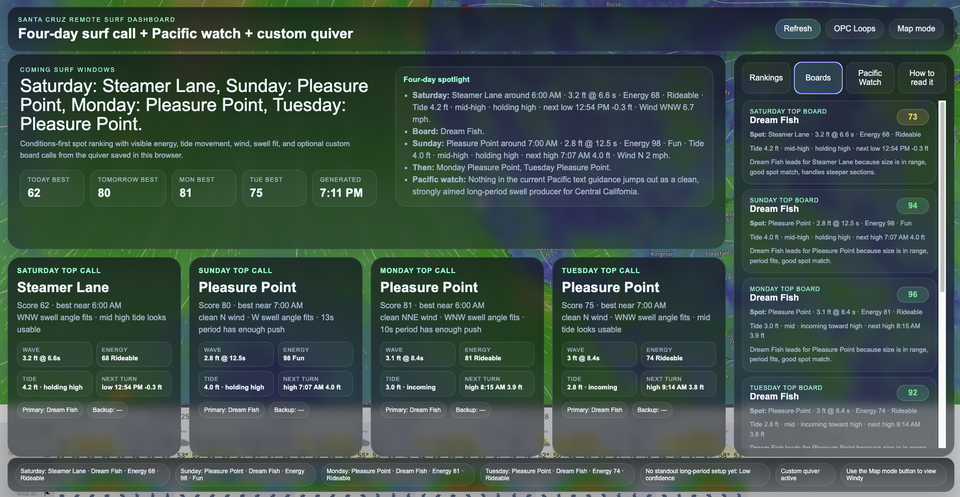
Step 3: Check the Main Forecast Cards
After your quiver is added, return to the main forecast cards.
Each forecast card gives a quick surf call for an upcoming day. It shows the recommended spot, best approximate time, and the board that best fits the conditions.
Each card may include:
- recommended surf spot
- best approximate time
- surf score
- wave height
- swell period
- swell direction
- wind speed and direction
- wave energy
- tide behavior
- recommended board
The score is meant to give a quick read on the overall setup. A higher score usually means better wind, better swell direction, more useful period, and a tide that fits the spot.
The dashboard is not meant to replace your own judgment, but it gives you a stronger starting point.
Step 4: Understand the Board Recommendation
Once your quiver is entered, the dashboard can recommend a board for each forecast window.
The board recommendation considers:
- wave size
- swell period
- wave energy
- spot type
- board type
- your board preference rating
- the role or notes you entered for the board
For example:
- a fish may be recommended for clean, playful point surf
- a midlength may be recommended when paddle, glide, and forgiveness matter
- a groveler may be recommended for smaller or softer surf
- a more performance-oriented board may be recommended when the waves are cleaner, steeper, or more powerful
The recommendation is not based only on volume. It is meant to combine board design, conditions, and personal preference.
Step 5: Use the Windy Map
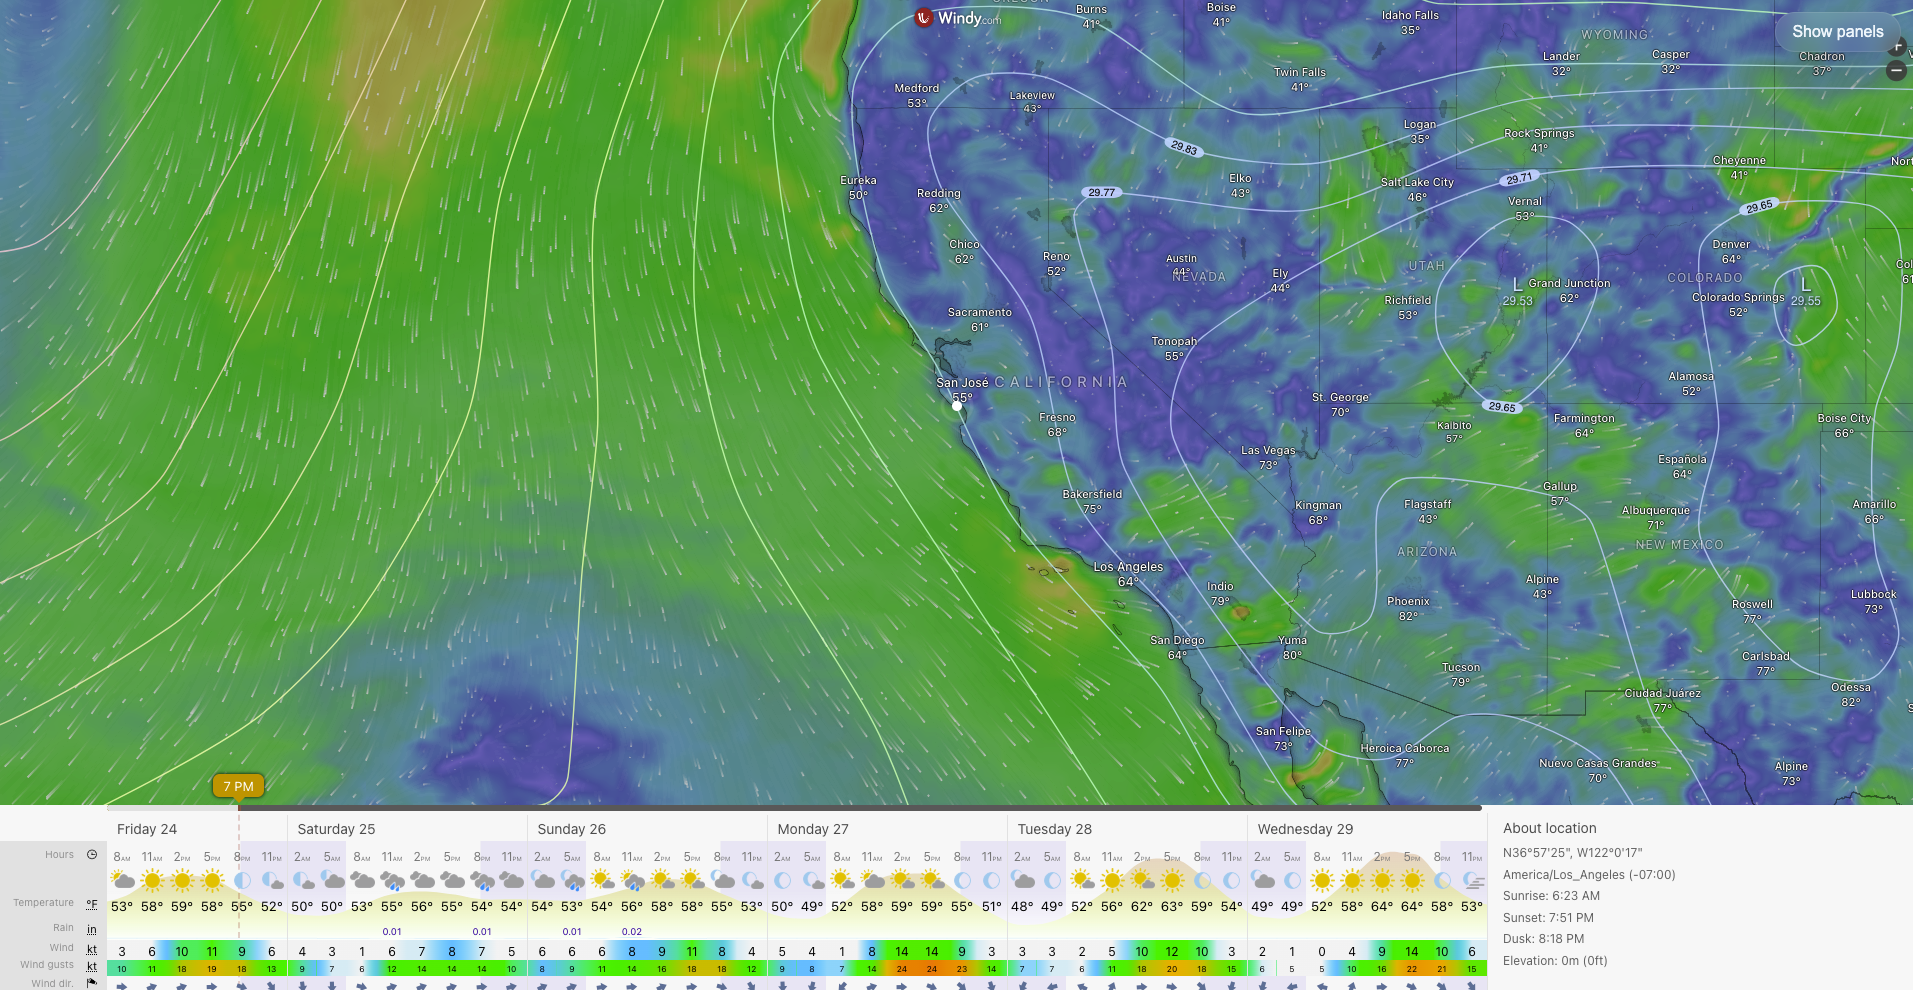
The Windy map is the visual foundation of the dashboard.
It helps you see the larger weather and wind pattern behind the forecast.
Use it to check:
- local wind direction
- coastal wind texture
- offshore or onshore trends
- pressure systems
- storm activity
- possible future swell-generation zones
If the dashboard panels are covering too much of the map, use Map Mode.
Map Mode hides the forecast panels so you can focus on the wind map. When you are done looking at the map, use the on-screen button to bring the dashboard panels back.
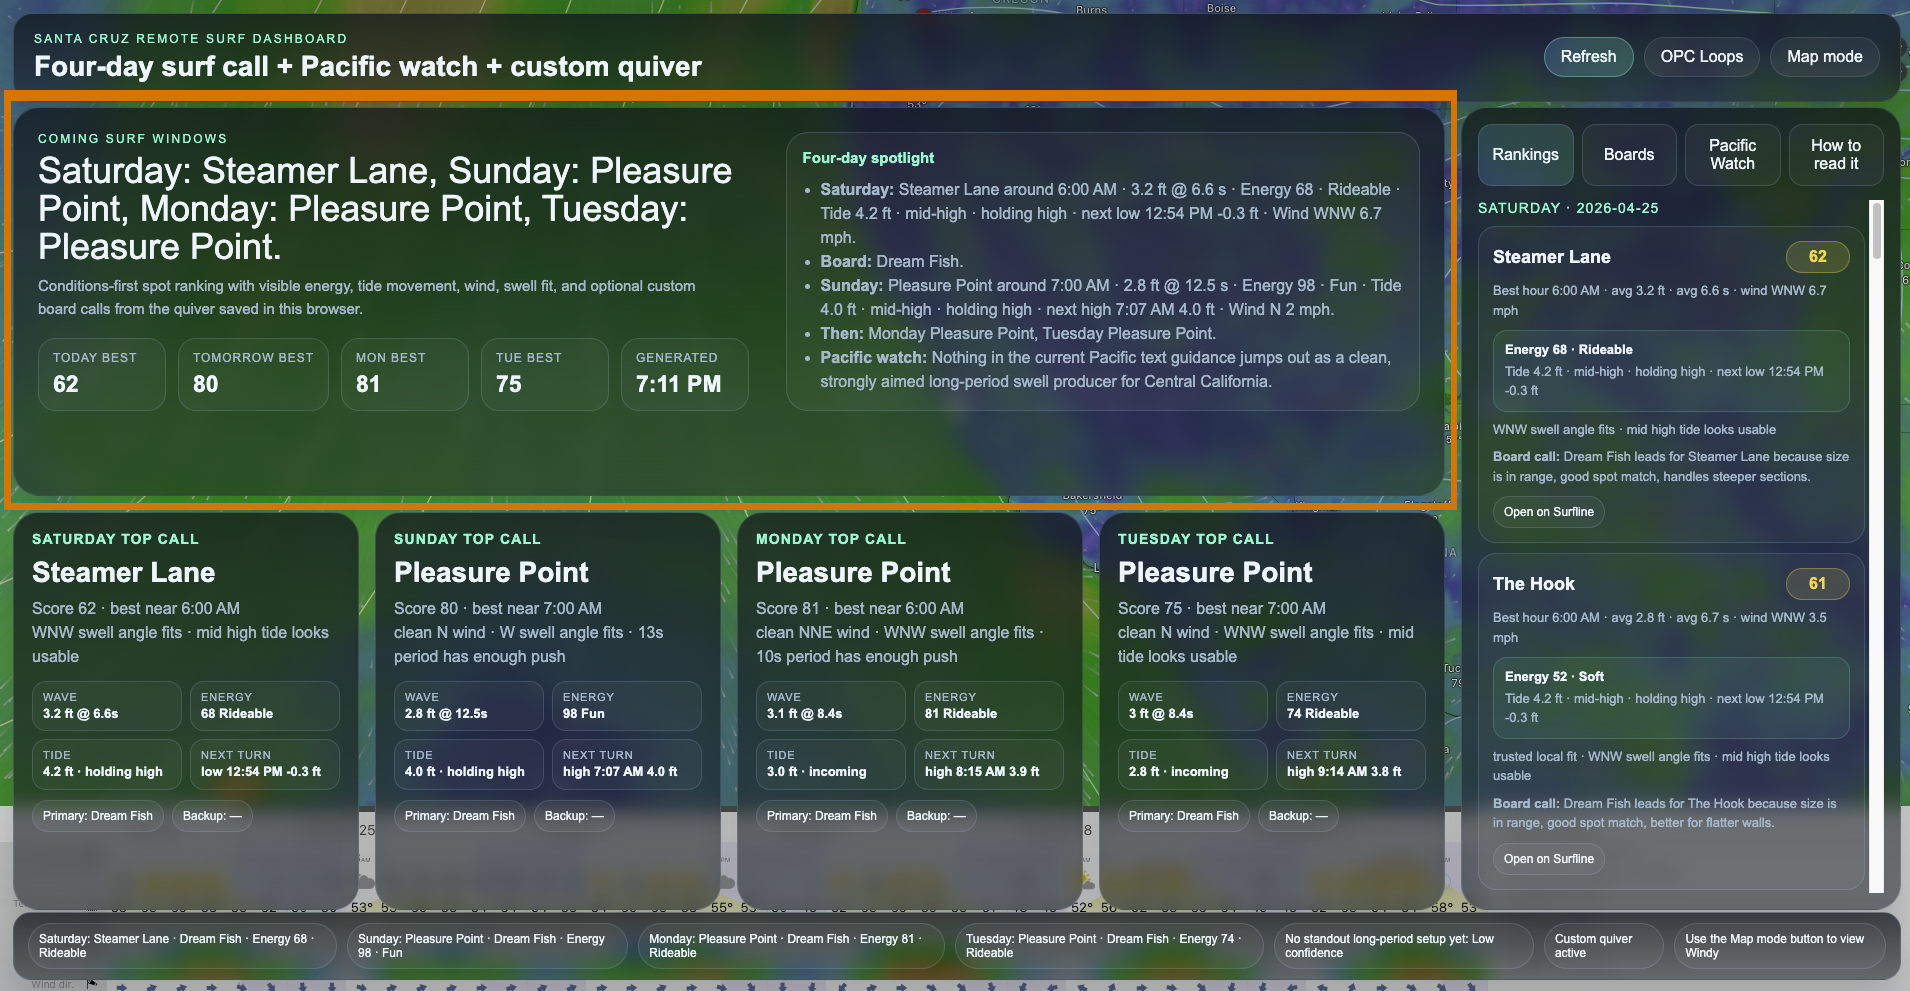
Step 6: Check the Rankings Tab
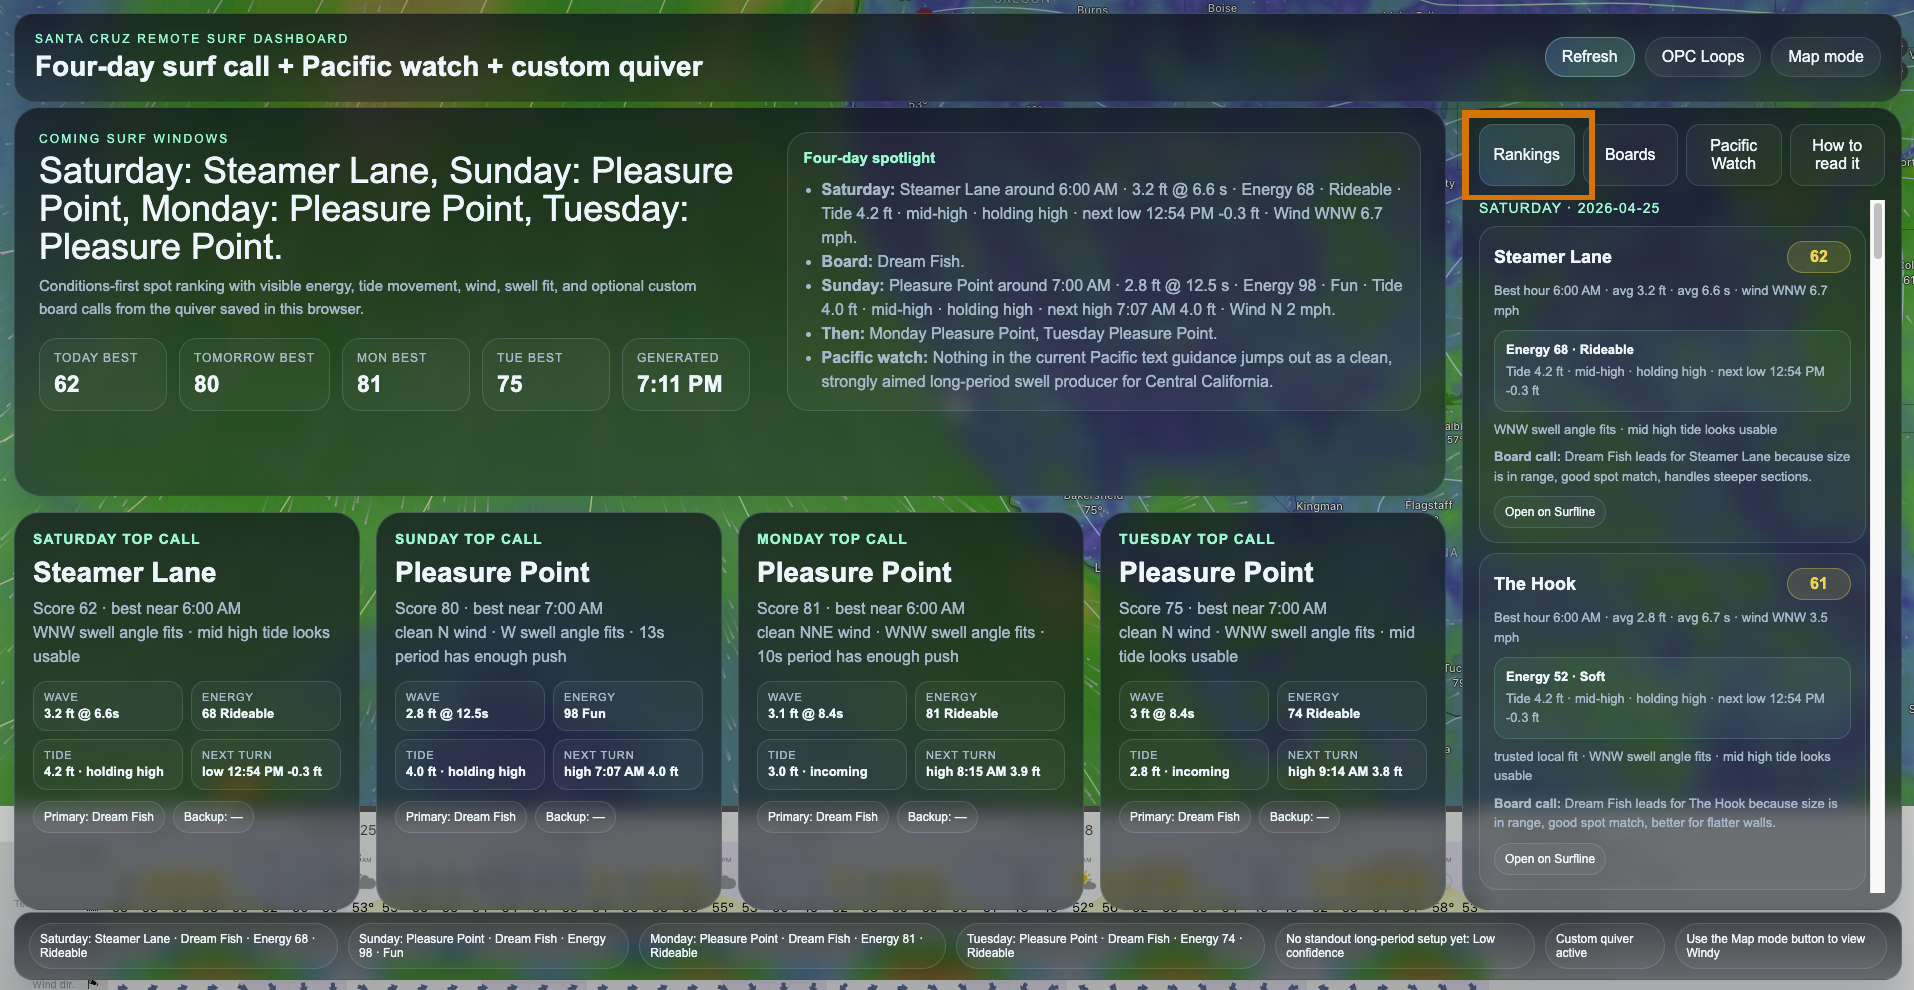
The Rankings tab gives a deeper comparison of surf spots.
Instead of only showing the top call, it ranks the available spots against the forecast window.
The ranking considers:
- swell height
- swell period
- swell direction
- wind quality
- tide fit
- wave energy
- spot-specific preferences
This is useful when you want to compare options.
For example:
- Is the top spot only slightly better than the second option?
- Is your favorite spot still worth checking?
- Is a less common spot scoring better because the conditions fit it unusually well?
- Is the surf clean but too small?
- Is there size, but the tide or wind is not ideal?
The Rankings tab helps explain why one spot is being favored over another.
Step 7: Understand Wave Energy
The dashboard includes a simple wave-energy estimate using a surfer-friendly shortcut:
Wave Energy ≈ wave height² × swell period
For example:
3 ft @ 12 seconds
3² × 12 = 108
This is not a perfect scientific wave-power calculation, but it is useful for comparing how much push the surf may have.
A smaller wave with a longer period can have more power than it looks like on paper. A larger wave with a short period may look decent in size but feel weak or jumbled.
The dashboard uses energy labels such as:
- Weak
- Soft
- Rideable
- Fun
- Punchy
- Strong
This helps you quickly understand whether the surf is likely to have enough push for your board and ability level.
Step 8: Read the Tide Details
Tide can completely change how a surf spot works.
The dashboard shows tide behavior in plain language, not just a number.
You may see labels such as:
- incoming toward high
- outgoing toward low
- holding high
- holding low
This tells you whether the tide is rising, falling, or near a tide turn.
For example, a spot may have good swell and clean wind, but if the tide is draining too fast or getting too high, the quality can change quickly.
The tide label helps make that easier to understand at a glance.
Step 9: Use the Pacific Watch Section
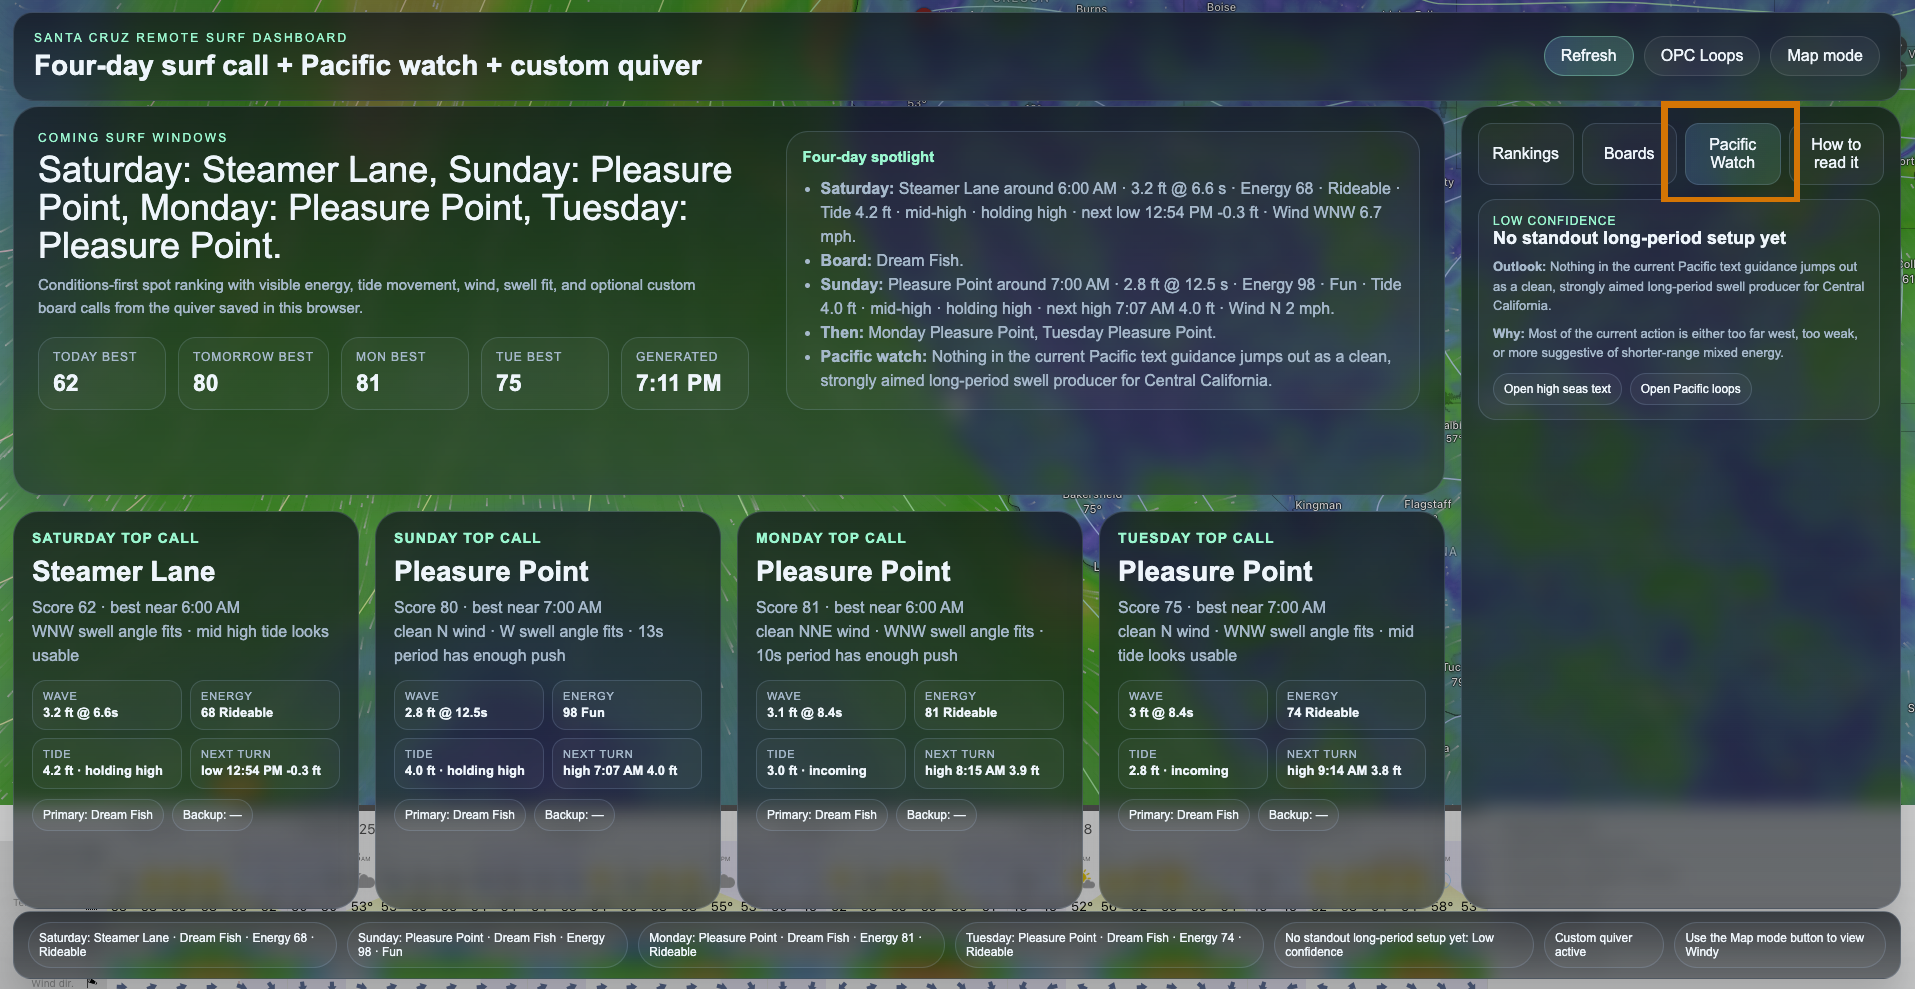
The Pacific Watch section is for looking beyond the immediate local forecast.
It helps identify possible swell-generating activity in the Pacific, such as:
- stronger wind fetches
- developing low-pressure systems
- larger storm systems
- possible WNW/NW swell sources
- longer-range swell signals
This is not a guaranteed swell forecast. It is more like an early warning layer.
Use it to ask:
- Is anything interesting forming in the Pacific?
- Could there be a better swell next week?
- Are there storm systems worth watching?
- Is the current forecast likely to improve?
This section works especially well when combined with the Windy map.
Step 10: Use the Dashboard on Mobile
The dashboard is designed to work on mobile.
On a phone, the layout stacks into a single scrolling page so the forecast cards, rankings, board tools, and Pacific Watch section are easier to use.
For the best experience:
- start in the Boards tab and add your quiver
- check the main forecast cards
- use the Rankings tab to compare spots
- use the Boards tab to review board recommendations
- use Map Mode when you want a cleaner view of the wind map
The mobile version is useful for a quick morning check before deciding whether to load the car.
Step 11: Final Surf Check Workflow
A good workflow looks like this:
- Add your boards in the Boards tab.
- Check the main forecast cards.
- Review the recommended spot and time.
- Check the recommended board.
- Review wave energy and tide behavior.
- Open the Rankings tab if you want to compare spots.
- Use Map Mode to look at the wind pattern.
- Confirm with a live cam or local observation before heading out.
The dashboard helps narrow the decision quickly, but the final call should still include your own experience, local knowledge, and a visual check.
Final Thoughts
The Surf Forecast Dashboard is built to make surf planning faster, clearer, and more personal.
It combines forecast data, wind visualization, tide behavior, wave energy, spot ranking, and board recommendations into one tool.
The most important feature is personalization. Once you add your own quiver, the dashboard becomes more than a generic forecast page. It becomes a custom surf decision tool built around the boards you actually ride.
It does not replace time in the water or checking the waves with your own eyes.
But it does make the call a lot easier.